Here’s the repro steps:
- Install tkinter to the embedded Python folder.
- Run the Debbuger Integration - Python demo and put the following code:
from tkinter import *

ws = Tk()
ws.title('PythonGuides')
ws.geometry('300x200')
ws.config(bg='#4a7a8c')

Button(
    ws,
    text='Exit',
    command=lambda:ws.destroy()
).pack(expand=True)

ws.mainloop()
- Start the script.
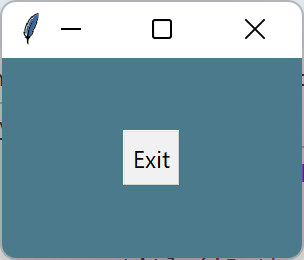
- It shows the following window:

- Click the Exit button.
- The debugger finishes execution.
- Now, set a breakpoint at 14 where “ws.mainloop()” exists.
- Start the script.
- The breakpoint is hit as expected.
- Now, click the “Locals” tab.
- The tkinter window may or may not appear. But that’s ok.
- The Debugger Integration demo window completely hangs.
- You need to kill the process by using the task manager.
I guess that the hang occurs at Alternet.Scripter.Debugger.Python.ExpressionEvaluation.DynamicMembersEvaluator.GetTypeName.ExtractTypeName(pyObject.GetAttr(ClassKey).ToString());
I looked at the PyObject.ToString() method. It uses GIL(). So, I guess it’s a deadlock. Is there a way to see if GIL has already been taken?