Hello, I am looking to add a debugging feature to an editor embedded within our application, so I was wondering if AlterNET would provide the capabilities to do so.
A bit about our workflow:
• Our main program has an API that can be accessed, such as in a visual studio project, by referencing the ProjectAPI .dll and these extensions/external projects can be run from within the main application and use the API to produce some action
• One such extension, compiled as ScriptEditor.dll, provides a script editor that can compile and run user-defined scripts that use the same ProjectAPI to produce some action
We want to add the debugging feature to this editor. At the moment, the ScriptEditor.dll reads the user’s script text from the editor, compiles, and executes it. Would we be able to use components from the AlterNET Script Debugger for this case? If so, are there examples of this that I could look at?
Another question: I was trying to use the ScriptDebugger in a separate context just to see it working, but I couldn’t actually get it to start. I am currently just providing the source code to a ScriptRun object (loading from a text file), giving that to a ScriptDebugger, and calling debugger.StartDebugging(), but it seems like more is involved to get it started – I’m just not sure what.
Thanks in advance
Hi,
Thank you for the interest in our products.
One of the limitations of the .NET platform debugging is that a process cannot debug itself.
See this article for more details: You can't debug yourself | Microsoft Docs
This imposes the following restriction on what can be done: the script must be executed in a separate process from the debugger. The final solution can be arranged in one of the two ways:
-
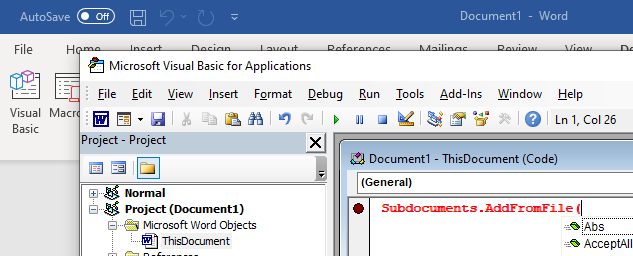
Debugger together with editor reside in a separate process and attach to the main application (with the application process having some scripts running) in order to debug it. This is a traditional approach similar to a regular application development scenario, when IDE is used to debug an application. From the user perspective, this can look like a separate debugger/editor window opened on-demand my the main application. For example, MS Office opens the VBA editor/debugger in a separate window:
Such an approach can be easily implemented based on our AlternetStudio demo application, which in itself is actually a script IDE, and can be attached to any running .NET application to debug managed code. Please refer to DebugMyScript quick start sample to see how it can be done.
-
Debugger with the editor resides in the main application process, but the script itself runs in a separate process and communicates with the main application via IPC mechanism such as .NET Remoting. Implementing this is less straightforward and the additional complexity it introduces is rarely justified by anything except the debugging features. We advice to go this way only if editing/debugging from the main process UI is a must. Such approach is demonstrated in our DebugRemoteScript quick start sample.
Regarding how to use our debugger together with your existing editor. Please download the two code files from here. The classes in the linked files (ScriptCodeEdit.cs and DebugCodeEdit.cs) derive from SyntaxEdit (our editor) and add the required “glue logic” to link it with the debugger by implementing IDebugEdit and IScriptEdit interfaces. You can follow the same way for integrating the debugger with your editor. For a quick start, you can take the StudioDemo project and modify it by adding MyCustomDebugEdit class similar to the one I linked you above. After that, you can change MainForm.CreateDebugEdit() method to return your custom editor.
Please let me know if you need any further help with this.
Yevgeni.
Thank you for the info!
I am trying to go through the first step, and I am able to run the DebugMyScript quick start sample from within our main application. However, when I try to debug the script from the editor that opens when you click ‘Start Debugging’, I get the following exception thrown in the AlterNET studio:
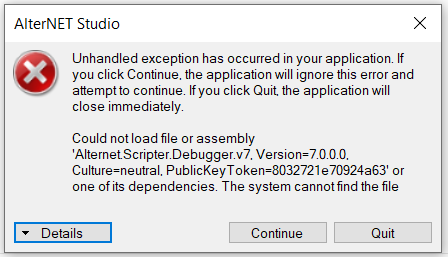
Do you know what might be causing this? I do not get this error if I just run AlternetStudio.exe from command line/file explorer.
EDIT: I was having this issue earlier and would still be interested in a fix, but now the debugger fails to open when ‘Start Debugging’ is pressed from the DebugMyScript form (called from our main application), and the ‘Start Script’ doesn’t cause any changes to occur and the square panel just stays black.
Is the problem you are experiencing reproducible on the samples that come with AlterNET Studio installation? If no, please send us a small sample which demonstrates the problem. In any case, please describe the problem in the following format:
Exact steps to reproduce the problem
- …
- …
Expected behavior
Actual behavior
Also, in addition to my first reply, I must mention we have IronPython scripting support, which does not have such debugging limitations, i.e. the application can debug itself with IronPython. To debug IronPython scripts in the same process you would need to run the scripts in a separate thread to allow the debugger UI thread to be unblocked when the script is paused. If the IronPython approach is of interest to you, please consult the IronPython quick start demos.
Hi Yevgeni,
As I was trying to reproduce my above problem in a separate project that does not involve our main project application, I kept running to a different problem. This problem also occurs with the demo.
Steps:
- Open the Demo Explorer, go to DebugMyScript (it happens in WPF and WinForms), and open the project
- Set the DebugMyScript project as the start-up project
- Click Run from Visual Studio (where I opened the project), and on the window clock ‘Start Debugging’ to open up AlterNET Studio
- Click the green arrow in AlterNET studio to start debugging.
Whereas debugging should occur, this exception is thrown: 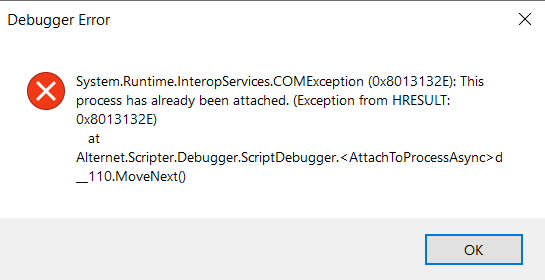
The same exception occurs in my sample as well. And this is just a barrier stopping me from reproducing my actual problem in isolation of our application.
Thanks for your help.
using System;
using System.Diagnostics;
using System.IO;
using System.Windows.Forms;
using Alternet.Scripter;
using Alternet.Scripter.Debugger;

namespace AlternetLaunchStudio
{
    class App
    {
        public static void Main()
        {
            Control c = new Control();
            c.Start();
            Console.Read();
        }

        private class Control : IScriptRemoteControl
        {
            private ScriptRun scriptRun;
            private string path;
            private bool scriptRunning;

            public Control()
            {
                const string ExeName = "AlternetStudio.exe";
                path = Path.Combine(@"C:\Users\Public\Documents\AlterNET Software\AlterNET Studio v.7\Bin",
                    ExeName);
                scriptRun = new ScriptRun();
                scriptRun.ScriptHost.GenerateModulesOnDisk = true;
                scriptRun.ScriptHost.ModulesDirectoryPath = Path.Combine(Environment.GetEnvironmentVariable("TEMP"), "Alternet Script Debugger Generated Modules");
                scriptRun.ScriptSource.WithDefaultReferences();
                scriptRun.AssemblyKind = ScriptAssemblyKind.DynamicLibrary;
                scriptRun.ScriptSource.FromScriptFile(@"C:\Resources\Scripter\CallMethod.cs");
                DebuggerCommunication.StartServer(this, null, null);

                scriptRunning = false;

            }

            public void CompileScript(ScriptCompiledDelegate onScriptCompiled)
            {
                var success = CompileScriptIfNeeded();

                InvokeOnScriptCompiled(
                    onScriptCompiled,
                    new ScriptCompilationResult
                    {
                        IsSuccessful = success,
                        TargetAssemblyName = scriptRun.ScriptHost.ExecutableModulePath,
                        Errors = scriptRun.ScriptHost.CompilerErrors
                    });

            }

            private void InvokeOnScriptCompiled(ScriptCompiledDelegate onScriptCompiled, ScriptCompilationResult result)
            {
                if (onScriptCompiled != null)
                {
                    try
                    {
                        onScriptCompiled(result);
                    }

                    catch (Exception e)
                    {
                        MessageBox.Show(e.ToString());
                    }
                }
            }

            private bool CompileScriptIfNeeded()
            {
                if (!scriptRun.Compiled)
                {
                    scriptRun.ScriptHost.AssemblyFileName = Guid.NewGuid().ToString("N") + ".dll";
                    return scriptRun.Compile();
                }

                return true;
            }

            public bool IsScriptRunning()
            {
                return scriptRunning;
            }

            public void Start()
            {
                Process.Start(
                    new ProcessStartInfo
                    {
                        UseShellExecute = false,
                        FileName = path,
                        Arguments =
                            $"\"-mainScriptFile={scriptRun.ScriptSource.ScriptFile}\" " +
                            $"\"-controlledProcessId={Process.GetCurrentProcess().Id}\" " +
                            $"\"-myCodeModules={scriptRun.ScriptHost.ExecutableModulePath}\" " +
                            $"\"-ipcPortName={string.Empty}\" " +
                            $"\"-ipcObjectUri={string.Empty}\"",
                    });
            }

            public void StartScript(ScriptFinishedDelegate onScriptFinished)
            {
                scriptRunning = true;
            }

            public void StopScript()
            {
                scriptRunning = false;
            }
        }
    }
}
Hi,
Most probably this is because you are starting the application with VS debugger, and then trying to attach a second debugger (the script debugger). Only one attached debugger at a time is supported and hence the error message.
Instead, please try running your application without debugging (Ctrl+F5 instead of F5).
I see, thank you. Now the demo works just fine from VS. I am still having other issues with trying to run the AlternetStudio from our program but I am looking to focus on other things, like what you suggested for using your debugger with our editor.
I looked at both of the classes and I made a quick MyCustomDebugEdit that was returned by MainForm.CreateDebugEdit() and that works fine. I am confused, however, about the precise role of this ‘MyCustomDebugEdit’ class.
It seems that this class, as you said, is the glue between our editor (our equivalent of SyntaxEdit) and your debugger. For example, the user toggles breakpoint B, which we detect/specify in our editor using our UI, and then the MyCustomDebugEdit class is responsible for telling your debugger that the user toggled breakpoint B - is this correct? If so, I am wondering where the logic is to actually start, stop, step over, etc with the debugger? I would have expected these methods to be a part of the ‘glue’ because our editor would have a ‘start debugger’ button, and when we detect that is pressed, we would tell the debugger to actually start, so I am wondering where this functionality should be implemented, and how?
Thank you for the continued support!