# Setting up debugging UI without tab control
**URL:** https://forum.alternetsoft.com/t/setting-up-debugging-ui-without-tab-control/506
**Category:** AlterNET Studio Support
**Created:** [August 10, 2025, 1:58am UTC](https://forum.alternetsoft.com/t/setting-up-debugging-ui-without-tab-control/506 "2025-08-10T01:58:07Z")
**Posts on this page:** 5
**Page:** 1
### Author:  [@Sirokai](https://forum.alternetsoft.com/u/Sirokai)
#### Post date: [August 10, 2025, 1:58am UTC](https://forum.alternetsoft.com/t/setting-up-debugging-ui-without-tab-control/506/1 "2025-08-10T01:58:08Z")
Hi, I have followed the Iron Python debugger demo (Windows Forms) and can successfully debug a script. However, in my project, my scripts are stored in a database and would be edited one at a time. I can’t figure out how to debug a script without creating a DebugCodeEditContainer which requires a tab control. I was hoping to simply add a DebugCodeEdit control directly onto my form. If I do this, I can get the code to run but it ignores my breakpoints.
It also seems that I need to save the script to disk and load it from disk using scriptRun1.ScriptSource.FromScriptFile for debugging to work. Using FromScriptCode does not seem to allow handling of break points.
Cheers,
John
---
### Author:  [@andrew.medvedev](https://forum.alternetsoft.com/u/andrew.medvedev)
#### Post date: [August 11, 2025, 12:19pm UTC](https://forum.alternetsoft.com/t/setting-up-debugging-ui-without-tab-control/506/2 "2025-08-11T12:19:35Z")
Hi Sirokai,
It’s possible to use the editor without tab control (you will need to set edit.. SingleEditorDebuggingUI to true).
Also, using the FromScriptCode method with an additional filename parameter and setting the same filename to the editor should allow debugging.
I’ve uploaded a sample demo here:
> **[DebuggerIntegrationNoTab.zip](https://drive.google.com/file/d/1USd7NTY3l7E-fZIvVNxTIOnyzKxoAdWF/view?usp=sharing)**
>
> Google Drive file.
The following code should not be required; we will fix it in the next minor update:
debugger.Options.DisableJustMyCode = false;
Please let me know if it works for you.
Regards,
Andrew
---
### Author:  [@Sirokai](https://forum.alternetsoft.com/u/Sirokai)
#### Post date: [August 11, 2025, 7:46pm UTC](https://forum.alternetsoft.com/t/setting-up-debugging-ui-without-tab-control/506/3 "2025-08-11T19:46:25Z")
Awesome - thanks that works. However when I break, I no longer have the tooltips to display the current values of variable. Is there an additional setting for that?
---
### Author:  [@andrew.medvedev](https://forum.alternetsoft.com/u/andrew.medvedev)
#### Post date: [August 12, 2025, 4:21am UTC](https://forum.alternetsoft.com/t/setting-up-debugging-ui-without-tab-control/506/4 "2025-08-12T04:21:19Z")
Hi John,
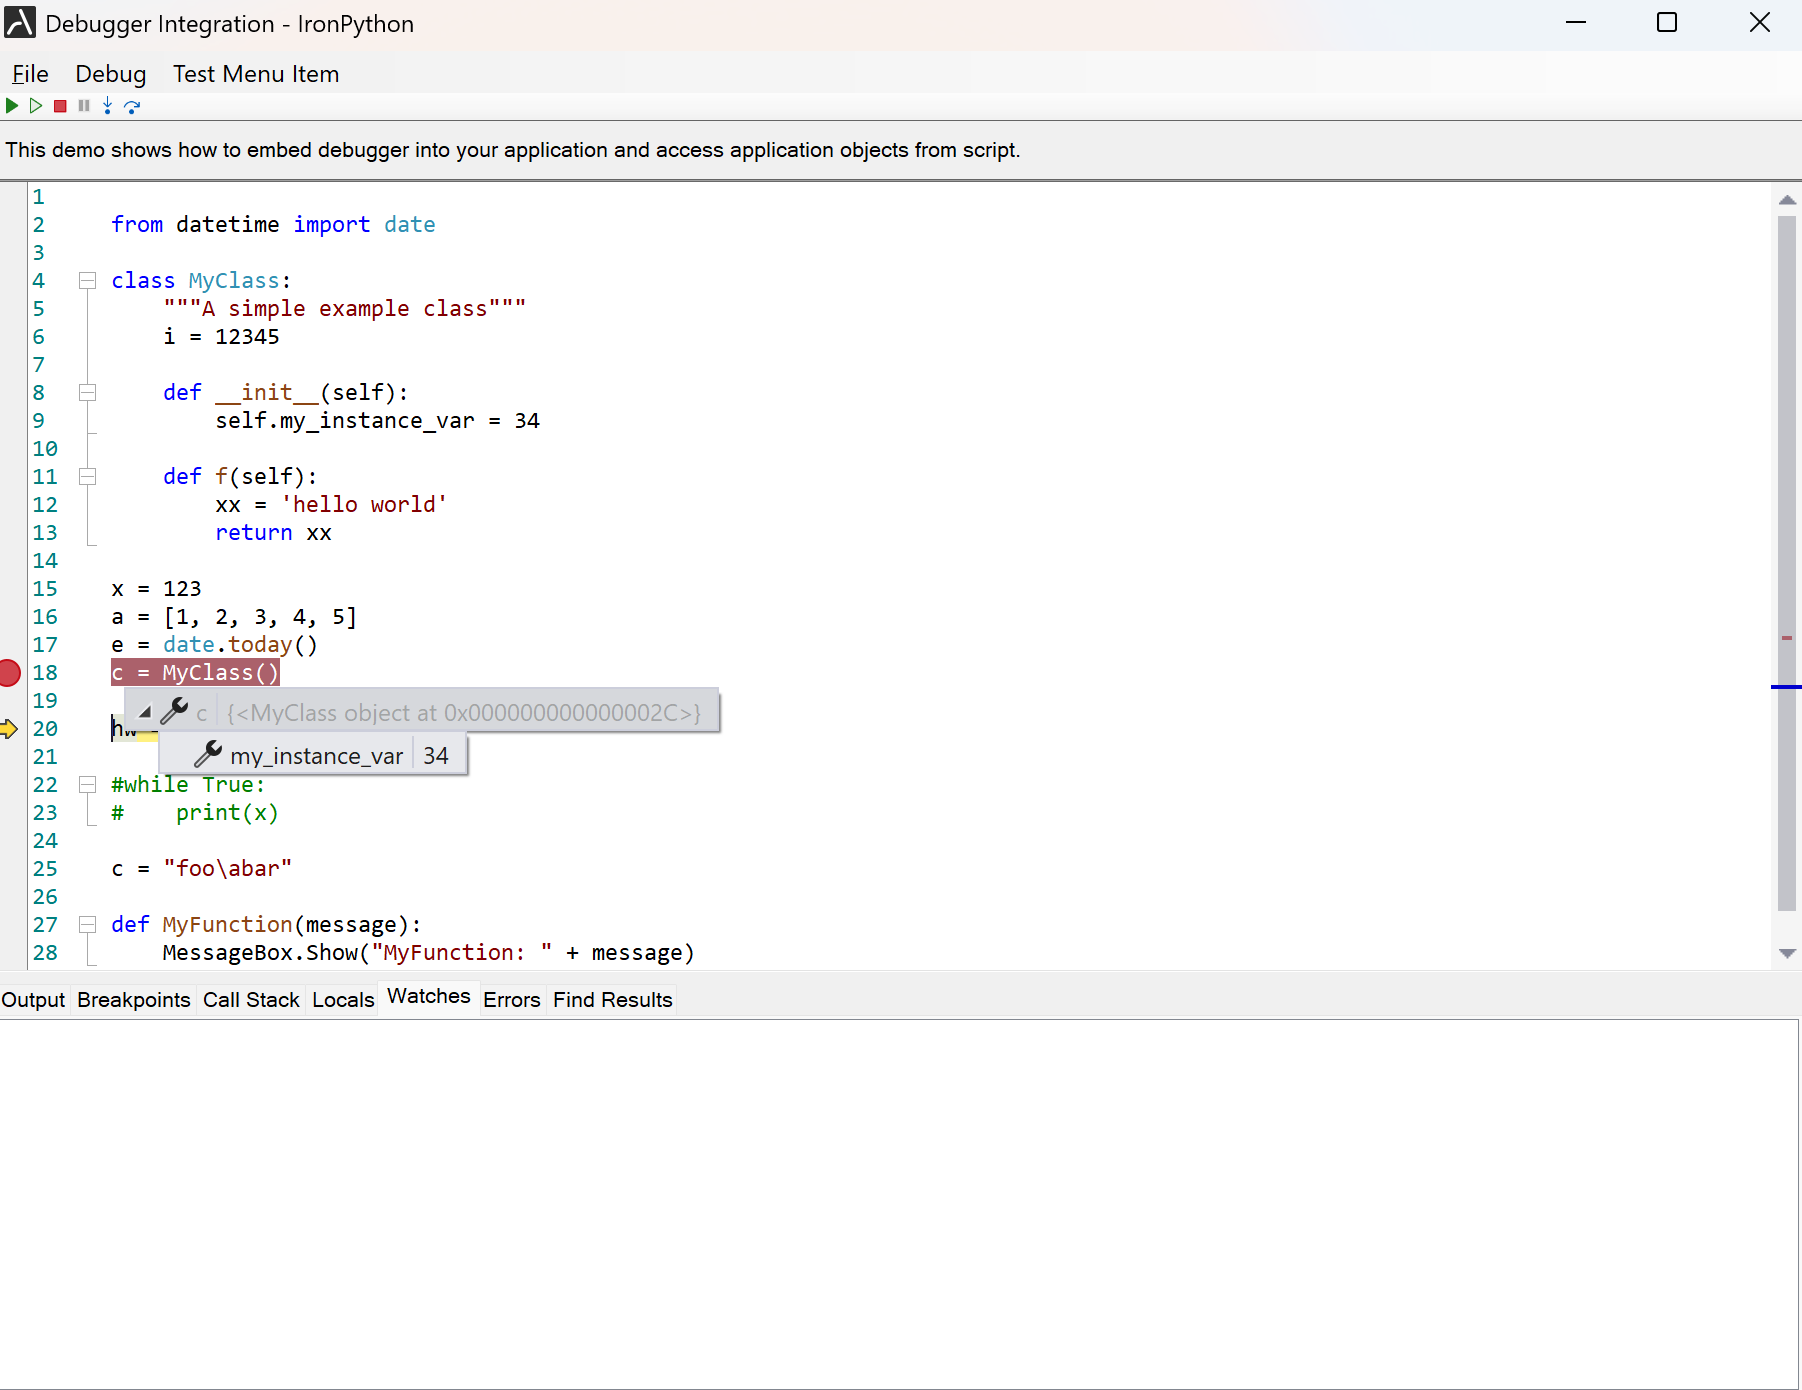
It seems that displaying debug tips when execution stops at a breakpoint works for me. Is this what you meant?
Regards,
Andrew
---
### Author:  [@Sirokai](https://forum.alternetsoft.com/u/Sirokai)
#### Post date: [August 12, 2025, 4:59am UTC](https://forum.alternetsoft.com/t/setting-up-debugging-ui-without-tab-control/506/5 "2025-08-12T04:59:42Z")
Yes that’s what I mean. I got it to work - it is just very particular about the order properties should be assigned. Thanks for your help.